Students will create videos that convince the rest of the 6th graders …
Students will create videos that convince the rest of the 6th graders that math is allaround them by doing activities that they love. Students will gather data, create dotplots, histograms and box-and-whisker plots to display data.
The Advanced Data Grapher can be used to analyze data with box …
The Advanced Data Grapher can be used to analyze data with box plots, bubble graphs, scatterplots, histograms, and stem-and-leaf plots. You can enter multiple rows and columns of data, select which set(s) to display in a graph, and choose the type of representation.
Students make up a set of eight numbers that simultaneously satisfy given …
Students make up a set of eight numbers that simultaneously satisfy given constraints. The mathematics task is intended to be a problem or question that encourages the use of mathematical practices. The dialogue is meant to show how students might engage in the mathematical practices as they work on the task.
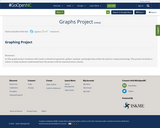
In this graph project students will create a statistical question, gather, analyze, …
In this graph project students will create a statistical question, gather, analyze, and graph data either by hand or using technology. The project includes a rubric to help students understand how the project will be assessed more clearly.
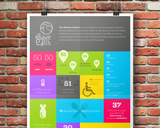
This website contains a graphic and video with simple vocabulary giving statistics …
This website contains a graphic and video with simple vocabulary giving statistics based on a world population of 100 people. It supports English Language development for English language learners.
Math 1 Statistics Project to assess students' knowledge of basic statistical information, …
Math 1 Statistics Project to assess students' knowledge of basic statistical information, and how to analyze their data. Students will be asking 20 students (or more if so desired by teacher) a question of their choice from a provided list. Students will then use their data to find mean, median, mode, range, and outliers; create a histogram and a box and whisker plot; and analyze their data by answering reflection questions. This project can bse used as a final test grade for a Math 1 statistics unit.
Distributions and Variability Type of Unit: Project Prior Knowledge Students should be …
Distributions and Variability
Type of Unit: Project
Prior Knowledge
Students should be able to:
Represent and interpret data using a line plot. Understand other visual representations of data.
Lesson Flow
Students begin the unit by discussing what constitutes a statistical question. In order to answer statistical questions, data must be gathered in a consistent and accurate manner and then analyzed using appropriate tools.
Students learn different tools for analyzing data, including:
Measures of center: mean (average), median, mode Measures of spread: mean absolute deviation, lower and upper extremes, lower and upper quartile, interquartile range Visual representations: line plot, box plot, histogram
These tools are compared and contrasted to better understand the benefits and limitations of each. Analyzing different data sets using these tools will develop an understanding for which ones are the most appropriate to interpret the given data.
To demonstrate their understanding of the concepts, students will work on a project for the duration of the unit. The project will involve identifying an appropriate statistical question, collecting data, analyzing data, and presenting the results. It will serve as the final assessment.
Getting Started Type of Unit: Introduction Prior Knowledge Students should be able …
Getting Started
Type of Unit: Introduction
Prior Knowledge
Students should be able to:
Solve and write numerical equations for whole number addition, subtraction, multiplication, and division problems. Use parentheses to evaluate numerical expressions. Identify and use the properties of operations.
Lesson Flow
In this unit, students are introduced to the rituals and routines that build a successful classroom math community and they are introduced to the basic features of the digital course that they will use throughout the year.
An introductory card sort activity matches students with their partner for the week. Then over the course of the week, students learn about the lesson routines: Opening, Work Time, Ways of Thinking, Apply the Learning, Summary of the Math, and Reflection. Students learn how to present their work to the class, the importance of taking responsibility for their own learning, and how to effectively participate in the classroom math community.
Students then work on Gallery problems to further explore the program’s technology resources and tools and learn how to organize their work.
The mathematical work of the unit focuses on numerical expressions, including card sort activities in which students identify equivalent expressions and match an expression card to a word card that describes its meaning. Students use the properties of operations to identify equivalent expressions and to find unknown values in equations.
Adapted from mathematicsvisionproject.com’s Material Overview: The Mathematics Vision Project (MVP) was created …
Adapted from mathematicsvisionproject.com’s Material Overview: The Mathematics Vision Project (MVP) was created as a resource for teachers to implement the Common Core State Standards (CCSS) using a task-based approach that leads to skill and efficiency in mathematics by first developing understanding. The MVP approach develops the Standards of Mathematical Practice through experiential learning. Students engage in mathematical problem solving, guided by skilled teachers, in order to achieve mathematical proficiency: conceptual understanding, procedural fluency, strategic competence, adaptive reasoning, and productive disposition. The MVP authors created a curriculum where students do not learn solely by either “internalizing what a teacher or book says or, on the other hand, solely by inventing mathematics on their own.” The MVP classroom experience begins by confronting students with an engaging problem and allows them to grapple with solving it. As students’ ideas emerge, take form, and are shared, the teacher deliberately orchestrates the student discussions and explorations toward a focused math goal. Students justify their own thinking while clarifying, describing, comparing, and questioning the thinking of others leading to refined thinking and mathematical fluency. What begin as ideas become concepts that lead to formal, traditional math definitions and properties. Strategies become algorithms that lead to procedures supporting efficiency and consistency. Representations become tools of communication which are formalized as mathematical models. Students learn by doing mathematics.
This lesson unit is intended to help you assess how well students …
This lesson unit is intended to help you assess how well students are able to: Calculate the mean, median, mode, and range from a frequency chart; and to use a frequency chart to describe a possible data set, given information on the mean, median, mode, and range.
Provides teaching tips, information on common errors, differentiated instruction, enrichment, and problem …
Provides teaching tips, information on common errors, differentiated instruction, enrichment, and problem solving for teachers to use with the CK-12 Middle School Math - Grade 6, Student Edition.
CK-12 Foundation's new and improved Advanced Probability and Statistics-Second Edition FlexBook introduces …
CK-12 Foundation's new and improved Advanced Probability and Statistics-Second Edition FlexBook introduces students to basic topics in statistics and probability, but finishes with the rigorous topics an advanced placement course requires.
CK-12 Advanced Probability and Statistics introduces students to basic topics in statistics …
CK-12 Advanced Probability and Statistics introduces students to basic topics in statistics and probability but finishes with the rigorous topics an advanced placement course requires. Includes visualizations of data, introduction to probability, discrete probability distribution, normal distribution, planning and conducting a study, sampling distributions, hypothesis testing, regression and correlation, Chi-Square, analysis of variance, and non-parametric statistics.
CK-12 Advanced Probability and Statistics Teacher's Edition provides tips and enrichment activities …
CK-12 Advanced Probability and Statistics Teacher's Edition provides tips and enrichment activities for teaching CK-12 Advanced Probability and Statistics Student Edition. The solution and assessment guides are available upon request.
Students will explore the overarching question, is the internet trustworthy?, while expanding …
Students will explore the overarching question, is the internet trustworthy?, while expanding their knowledge of statistics and comparing data sets. They will compare two data sets as well as determine the accuracy or bias of data representations shown on the internet. Students will then have the opportunity to apply their knowledge while creating their own visual representations for data they personally collected regarding the trustworthiness of the internet. The module concludes with a peer showcase and the post-assessment.
In this problem-based learning module students will connect these standards to their …
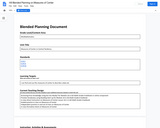
In this problem-based learning module students will connect these standards to their personal life by completing a random sample from their environment in the area of careers to investigate to see if their own career is environmentally challenged. Students will work independently as well as with a partner. Students will also complete a reflection in the form of a final product to make an inference and draw a conclusion about the population of their area in relation to careers. The final product will be presented to their peers and teachers, but also can be exhibited to their families. This blended module includes teacher-led instruction, student-led stations, partner comparisons and technology integrated investigations.
No restrictions on your remixing, redistributing, or making derivative works. Give credit to the author, as required.
Your remixing, redistributing, or making derivatives works comes with some restrictions, including how it is shared.
Your redistributing comes with some restrictions. Do not remix or make derivative works.
Most restrictive license type. Prohibits most uses, sharing, and any changes.
Copyrighted materials, available under Fair Use and the TEACH Act for US-based educators, or other custom arrangements. Go to the resource provider to see their individual restrictions.