
This parent guide supports parents in helping their child at home with the 7th grade Science content.
- Subject:
- Science
- Material Type:
- Reference Material
- Vocabulary
- Author:
- Kelly Rawlston
- Letoria Lewis
- Date Added:
- 10/11/2022

This parent guide supports parents in helping their child at home with the 7th grade Science content.

This resource accompanies our Rethink 7th Grade Science course. It includes ideas for use, ways to support exceptional children, ways to extend learning, digital resources and tools, tips for supporting English Language Learners and students with visual and hearing impairments. There are also ideas for offline learning.
Lesson plan that uses students' step length to understand the relationship between distance, speed and acceleration. Includes graphing of data and interpretation of graphs.

In this inquiry activity, students solve a 1D motion challenge in groups. Students build their own balloon rocket from the provided materials. They collect data and prepare a position vs. time graph of their data and determine the average velocity of the rocket.
This interactive resource is a compilation of text and other elements that serves as a multimedia learning experience for students. The resource describes how graphs can be shown to illustrate motion.

Students will connect the motion of an object to the corresponding position-time and velocity-time graphs to determine the velocity traveled during different time intervals.

In this lesson, students will connect the motion of an object to the corresponding position-time and velocity-time graphs to determine the velocity traveled during different time intervals.
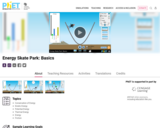
Sample Learning Goals
Explain the Conservation of Mechanical Energy concept using kinetic energy (KE) and gravitational potential energy (PE).
Describe how the Energy Bar and Pie Charts relate to position and speed.
Explain how changing the Skater Mass affects energy.
Explain how changing the Track Friction affects energy.
Predict position or estimate speed from Energy Bar and Pie Charts.
Calculate speed or height at one position from information about a different position.
Calculate KE and PE at one position from information about a different position.
Design a skate park using the concepts of mechanical energy and energy conservation.

In this lesson, students will investigate motion through a variety of activities in order to odentify changes in position and direction and the speed of an object. Students will also graph changes in motion.

This project applies the concepts of Friction, Gravity, Newton's Laws, Potential and Kinetic Energy, Speed, Distance vs. Time Graphs, and integrates them into a culminating project. Students work in pairs to create a marble run using basic classroom supplies and a standard tri-fold board. The goal is to create a marble run that takes as long as possible for the marble to complete without getting stuck. The project includes a data analysis section and a content questions component. There is also a scoring rubric included. The standards that this project covers can be found on the final page of the document. No special materials or tools are necessary.

In this activity, students interpret a graph by generating motion and speed that matches the graph. They will also create graphs that represent specific dance moves and motions.

In this lesson, students apply physics concepts, measuring force, with similar athletic tools used by Bethea.
This lesson is the second in a two-part series on the science of hurricanes and the kinds of technology being used to identify and track them. In this activity students? study of hurricanes is broadened by exploring how technology and science are used today to identify, measure, and track powerful tropical storms to better warn and secure people from their often-devastating impact.

In this investigation, students will learn that speed, velocity, and changes in velocity are the result of the action of forces on objects such as friction. Students will construct a simple, balloon powered car and race it on three different surfaces. Students will analyze their car's performance, identify design flaws and apply knowledge to improve their car. They will also graph class results for each of the three surfaces.

In this activity, students will collect and analyze data of their walking speed. They will compare their speed to an outside speed walker. They will determine their speed every 20 meters up to 100 meters. They will complete five trials to determine average time for each of the 20-meter segments. The students will write a lab report describing their results.

In this activity, students will study speed, measure and record time and distance, then graph results.
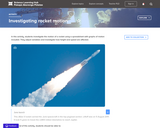
Students investigate the motion of a rocket using a spreadsheet with graphs of motion included. They adjust variables and investigate how height and speed are affected.
In this activity, students roll miniature cars down a ramp and measure speed and acceleration every 10 cm. Students manipulate variables such as type of car, height of ramp, or ramp material to investigate how these changes affect speed and acceleration. Values for speed and acceleration can be graphed; graphs can be compared and the slope differences discussed.
Students learn about the phsyics behind the Olympic luge event. In an associated activity, students will design and build super fast luges and exciting luge courses to investigate forces and friction. Students will run several time trials and collect and record data, then graph the results.

This assessment resource checks students' understanding of how motion can be represented on a graph.