This resource accompanies our Rethink 7th Grade Science course. It includes ideas …
This resource accompanies our Rethink 7th Grade Science course. It includes ideas for use, ways to support exceptional children, ways to extend learning, digital resources and tools, tips for supporting English Language Learners and students with visual and hearing impairments. There are also ideas for offline learning.
Lesson plan that uses students' step length to understand the relationship between …
Lesson plan that uses students' step length to understand the relationship between distance, speed and acceleration. Includes graphing of data and interpretation of graphs.
In this inquiry activity, students solve a 1D motion challenge in groups. …
In this inquiry activity, students solve a 1D motion challenge in groups. Students build their own balloon rocket from the provided materials. They collect data and prepare a position vs. time graph of their data and determine the average velocity of the rocket.
This interactive resource is a compilation of text and other elements that …
This interactive resource is a compilation of text and other elements that serves as a multimedia learning experience for students. The resource describes how graphs can be shown to illustrate motion.
Students will connect the motion of an object to the corresponding position-time …
Students will connect the motion of an object to the corresponding position-time and velocity-time graphs to determine the velocity traveled during different time intervals.
In this lesson, students will connect the motion of an object to …
In this lesson, students will connect the motion of an object to the corresponding position-time and velocity-time graphs to determine the velocity traveled during different time intervals.
In this lesson, students will investigate motion through a variety of activities …
In this lesson, students will investigate motion through a variety of activities in order to odentify changes in position and direction and the speed of an object. Students will also graph changes in motion.
This project applies the concepts of Friction, Gravity, Newton's Laws, Potential and …
This project applies the concepts of Friction, Gravity, Newton's Laws, Potential and Kinetic Energy, Speed, Distance vs. Time Graphs, and integrates them into a culminating project. Students work in pairs to create a marble run using basic classroom supplies and a standard tri-fold board. The goal is to create a marble run that takes as long as possible for the marble to complete without getting stuck. The project includes a data analysis section and a content questions component. There is also a scoring rubric included. The standards that this project covers can be found on the final page of the document. No special materials or tools are necessary.
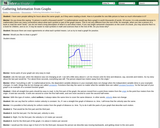
On this webpage, a simulated discussion about motion graphs between students and …
On this webpage, a simulated discussion about motion graphs between students and a mentor takes place with sample graphs illustrated. The discussion explains how to read motion graphs and what information we can gather from them.
In this activity, students interpret a graph by generating motion and speed …
In this activity, students interpret a graph by generating motion and speed that matches the graph. They will also create graphs that represent specific dance moves and motions.
Within the physical science strand of 7th grade science, students focus on …
Within the physical science strand of 7th grade science, students focus on the motion of objects. In this task, students assume the role of a xenobiologist and explain the motion of a fictional organism over a given time period. Students will then trade narratives and graphs and are challenged to identify the graph based on the information provided in the fictional narrative. Students will critique the accuracy of each other’s graph-based narratives. The interdisciplinary and writing aspects of this lesson allow students to build meaningful connections among curricula while promoting creativity and 21st Century Skills. This lesson was developed by NCDPI as part of the Academically and/or Intellectually Gifted Instructional Resources Project. This lesson plan has been vetted at the state level for standards alignment, AIG focus, and content accuracy.
Within the physical science strand of 7th grade science, students focus on …
Within the physical science strand of 7th grade science, students focus on the motion of objects. In this task, students will act as a car insurance company representative who is reviewing driving data from a vehicle’s diagnostic port and developing a personalized graph and written analysis for the customer to maximize good driving habits (and lessen the insurance company’s risk). Students will use the initial data and mathematical formulae to develop distance-time and velocity-time graphs through this activity. The real-world and interdisciplinary nature of this activity, as well as its inquiry basis, allows students to build meaningful connections while promoting 21st Century Skills. This lesson was developed by NCDPI as part of the Academically and/or Intellectually Gifted Instructional Resources Project. This lesson plan has been vetted at the state level for standards alignment, AIG focus, and content accuracy.
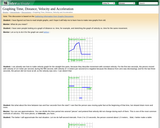
On this webpage, a discussion takes place between students and a mentor …
On this webpage, a discussion takes place between students and a mentor about making different types of motion graphs. Illustrations of the graphs discussed are included. This is the second in a series of discussions.
In this activity, students will collect and analyze data of their walking …
In this activity, students will collect and analyze data of their walking speed. They will compare their speed to an outside speed walker. They will determine their speed every 20 meters up to 100 meters. They will complete five trials to determine average time for each of the 20-meter segments. The students will write a lab report describing their results.
In this activity, students roll miniature cars down a ramp and measure …
In this activity, students roll miniature cars down a ramp and measure speed and acceleration every 10 cm. Students manipulate variables such as type of car, height of ramp, or ramp material to investigate how these changes affect speed and acceleration. Values for speed and acceleration can be graphed; graphs can be compared and the slope differences discussed.
In this lesson, students investigate motion graphs. Students predict what the distance-time …
In this lesson, students investigate motion graphs. Students predict what the distance-time and velocity-time graphs would look like for a student walking across the room for several different scenarios. Then students will use a motion detector to act out these scenarios and compare their predictions to those produced from the motion detector.
No restrictions on your remixing, redistributing, or making derivative works. Give credit to the author, as required.
Your remixing, redistributing, or making derivatives works comes with some restrictions, including how it is shared.
Your redistributing comes with some restrictions. Do not remix or make derivative works.
Most restrictive license type. Prohibits most uses, sharing, and any changes.
Copyrighted materials, available under Fair Use and the TEACH Act for US-based educators, or other custom arrangements. Go to the resource provider to see their individual restrictions.