
This parent guide supports parents in helping their child at home with the 8th grade Science content.
- Subject:
- Science
- Material Type:
- Reference Material
- Vocabulary
- Author:
- Kelly Rawlston
- Letoria Lewis
- Date Added:
- 10/11/2022

This parent guide supports parents in helping their child at home with the 8th grade Science content.

This resource accompanies our Rethink 8th Grade Science course. It includes ideas for use, ways to support exceptional children, ways to extend learning, digital resources and tools, tips for supporting English Language Learners and students with visual and hearing impairments. There are also ideas for offline learning.

This interactive activity demonstrates and provides explanation for how acid rain affects aquatic ecosystems and how certain species react to decreased water quality as pH becomes lower. The activity also explains the pH scale as a measure of acidity.

In this lesson, students complete water quality tests such as pH, dissolved oxygen, nitrates, phosphates, and salinity for a water sample. After following these activities, students should understand the purpose of these tests, know how to run accurate water quality tests, and see how these parameters relate to the quality of the water in an estuary.
ACE Education is the Agapé Center for Environmental Education, a carefully developed and integrated program designed to meet the goals set forth by the NC Department of Public Instruction. ACE Education is a creative way to meet NC Essential Standards for Science and Social Studies. ACE Education experiences make use of experiential learning – proven to be the most effective method of education.

Students work collaboratively to design a plan or device to clean up the oceans. Students will individually write 2 short essays on topics of their choice while making a mock schedule to implement their plan/device. They will research a government official to explain their plan/device. Finally, they will create a video to explain the cause, solution, and how the process will be carried out.

This lesson plan demonstrates how microorganisms normally found in environments, such as the bottom of warm freshwater ponds and lakes can cause illness when they enter the human body. Students engaged in this lesson plan will learn about N. fowleri (the scientific name of the brain-eating ameba), where it lives, how it can cause infection, and how persons can protect themselves from this infection.Students will also have the opportunity to identify other organisms living in local freshwater reservoirs, such as ponds and lakes. At the end of the lesson, students should have an enhanced understanding of the environment's role in disease transmission and ways to reduce the risk for contracting waterborne infections.
Students will create a model aquatic ecosystem and make regular observations over a period of time. They will also work collaboratively to conduct research on common ocean health issues and summarize their findings in a written report.

This video provides information about the causes and effects of Earth's changing climate, specifically focusing on wildlife populations and the impact global warming has on habitats.
Adding lemon juice to water increases the water's acidity; adding carbon dioxide to water will also increase acidity. The effects of the carbon dioxide acidification of ocean water from burning fossil fuels are discussed and images of some of the organisms adversely affected by that acidification are included. This article is part of the Climate Kids website, a NASA education resource featuring articles, videos, images and games focused on the science of climate change.
Students will construct an ecocolumn and use it to study the interaction between the geosphere, hydrosphere, atmosphere, and biosphere.
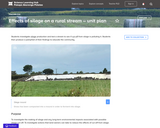
In this activity, students investigate silage production and test a stream to see if run-off from silage is polluting it. Students then produce a pamphlet of their findings to educate the community.

This guide was developed to support teachers in teaching topics with real-world context, and provide them with the background to feel competent and comfortable when teaching about fresh water. The guide includes numerous education features, such as teaching tips and student thinking, that help to connect the content to classroom practice.
There are many different ways to precisely measure the quality of water in a river. Environmental scientists and volunteers all over the state of Michigan are continuously collecting measurements of the quality of water in rivers, streams, and lakes. Students will look at two of these measures to see how they change with location around the state and along a river. The first measure of water quality is called "water conductance" - that is, how well a water sample can conduct electricity. A higher water conductance generally means lower water quality. The second measure of water quality is "pH." pH is a measure of how acidic or basic water is. Successful students will be able to interpret and analyze data using these two measures to better understand Michigan water quality.
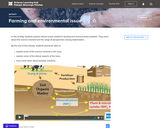
Students explore ethical issues related to farming and environmental pollution. They learn about the science involved and the range of perspectives among stakeholders.

In this lesson, students participate in a kinesthetic simulation to illustrate how nutrient pollution from agricultural runoff can lead to a dead zone at the mouth of a drainage basin.
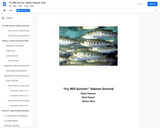
Students will be able to design and defend a salmon rearing tank for the highest survival rate. They will measure temperature, ph and ammonia on daily basis and make needed adjustments. Given unit ending data students will be able to determine the optimal design for a salmon rearing tank using patterns between water conditions and survival rates.

In this lesson, students will identify and name different aquatic insects. Students will create a graphic representation of the number of different species found, then use the data to determine the quality of the water in which the insects were found.
In this unit, students develop an appreciation of the global, dynamic, and complex nature of the water cycle and explain how human activities can impact the functioning of the water cycle.

In this activity, students will interpret how biological indicators are used to gauge the health of a stream and practice calculating the biotic index of a simulated stream site in order to analyze the water quality.