In Part 1 of this unit, students will learn about data collection, …
In Part 1 of this unit, students will learn about data collection, graphing skills (both by hand and computer aided [Desmos]), and the fundamental mathematical patterns of the course: horizontal line, proportional, linear, quadratic, and inverse. Students perform several experiments, each targeting a different pattern and build the mathematical models of physical phenomena. During each experiment, students start with an uninformed wild guess, then through inquiry and making sense through group consensus, can make an accurate data informed prediction.
Students can work individually or in groups of 3 or 4 to …
Students can work individually or in groups of 3 or 4 to create a solar oven out of a pizza box. Students are trying to figure out the best way to make a solar oven in order to melt the chocolate and marshmallow in the S’more. Students will be given a group of objects and tell them the basis of how to create a solar oven. The oven will need to be placed in direct sunlight for most of the day. This experiment works best on a very hot, sunny day.
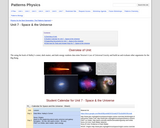
By using the hook of Halley’s comet, dark matter, and dark energy …
By using the hook of Halley’s comet, dark matter, and dark energy students data mine Newton’s Law of Universal Gravity and build an and evaluate other arguments for the Big Bang.
In this fun interactive, students use the slingshot to pop as many …
In this fun interactive, students use the slingshot to pop as many balloons as they can as the balloons pass by. There is a set of ten balloons for each round and when all ten balloons have passed or been popped, students receive a score. Students drag the 'x' to the column which matches their score. As students complete each round, he/she creates a line plot using their scores as data.
This article provides a brief discussion of the importance of teaching students …
This article provides a brief discussion of the importance of teaching students to analyze data and representations of data as well as two resources that can help teachers implement these strategies into their instruction.
Data can be used to help students understand their world and answer …
Data can be used to help students understand their world and answer interesting questions. In this lesson, students will collect data from a Play Lab project and visualize it using different kinds of graphs.
By running a simple simulation in Sprite Lab, students will experience how …
By running a simple simulation in Sprite Lab, students will experience how computing can be used to collect data that identify trends or patterns. After running the simulation multiple times, students will have an opportunity to make a prediction about how changing a variable in the simulation might impact the outcome, and then test that hypothesis.
This editable google slide can be used by students to track their …
This editable google slide can be used by students to track their assessment data and standards progression in Civic Literacy. This resource was developed as part of a professional learning opportunity funded by the NCDPI Digital Learning Initiative Planning Grant.
Collecting and analyzing data to write Present Levels of Performance and IEP …
Collecting and analyzing data to write Present Levels of Performance and IEP goals is a critical component of the special education process. By systematically gathering information on a student's academic, behavioral, social, and functional skills, educators can develop a comprehensive understanding of the student's strengths and areas in need of improvement. This data-driven approach helps to ensure that IEP goals are specific, measurable, attainable, relevant, and time-bound (SMART), promoting student success and progress. Additionally, collecting ongoing data allows educators to monitor the effectiveness of interventions and make informed decisions about modifying instructional strategies or accommodations. Ultimately, meticulously documenting present levels of performance and setting appropriate IEP goals based on objective data not only complies with legal requirements but also empowers educators to provide targeted support tailored to each individual student's unique needs.
Students collect weather data over several days or weeks, graph temperature data, …
Students collect weather data over several days or weeks, graph temperature data, and compare the temperature data collected with long-term climate averages from where they live. Understanding the difference between weather and climate and interpreting local weather data are important first steps to understanding larger-scale global climate changes.
There are many simple experiments students can do to analyze data. They …
There are many simple experiments students can do to analyze data. They can test two objects designed to solve the same problem and compare the strengths and weaknesses of how each performs. The teacher will create a spreadsheet to collect the data to share with the students.
Students will explore data and create a scatter plot to determine if …
Students will explore data and create a scatter plot to determine if there is a correlation between the numbers of votes a movie received for best film and the amount of money the movie made at theaters.
This article discusses how the study of weather can meet the NCTM …
This article discusses how the study of weather can meet the NCTM Data Analysis and Probability standard. Links to lessons for grades K-2 and 3-5 are provided.
Distributions and Variability Type of Unit: Project Prior Knowledge Students should be …
Distributions and Variability
Type of Unit: Project
Prior Knowledge
Students should be able to:
Represent and interpret data using a line plot. Understand other visual representations of data.
Lesson Flow
Students begin the unit by discussing what constitutes a statistical question. In order to answer statistical questions, data must be gathered in a consistent and accurate manner and then analyzed using appropriate tools.
Students learn different tools for analyzing data, including:
Measures of center: mean (average), median, mode Measures of spread: mean absolute deviation, lower and upper extremes, lower and upper quartile, interquartile range Visual representations: line plot, box plot, histogram
These tools are compared and contrasted to better understand the benefits and limitations of each. Analyzing different data sets using these tools will develop an understanding for which ones are the most appropriate to interpret the given data.
To demonstrate their understanding of the concepts, students will work on a project for the duration of the unit. The project will involve identifying an appropriate statistical question, collecting data, analyzing data, and presenting the results. It will serve as the final assessment.
Students use the Box Plot interactive, which allows them to create line …
Students use the Box Plot interactive, which allows them to create line plots and see the corresponding box plots. They use this tool to create data sets with box plots that satisfy given criteria.Students investigate how the box plot changes as the data points in the line plot are moved. Students can manipulate data points to change aspects of the box plot and to see how the line plot changes. Students create box plots that fit certain criteria.Key ConceptsThis lesson focuses on the connection between a data set and its box plot. It reinforces the idea that a box plot shows the spread of a data set, but not the individual data points.Students will observe the following similarities and differences between line plots and box plots:Line plots allow us to see and count individual values, while box plots do not.Line plots allow us to find the mean and the mode of a set of data, while box plots do not.Box plots are useful for very large data sets, while line plots are not.Box plots give us a better picture of how the values in a data set are distributed than line plots do, and they allow us to see measures of spread easily.Goals and Learning ObjectivesExperiment with different line plots to see the effect on the corresponding box plots.Create data sets with box plots that satisfy different criteria.Compare and contrast line plots and box plots.
GalleryCreate a Data SetStudents will create data sets with a specified mean, …
GalleryCreate a Data SetStudents will create data sets with a specified mean, median, range, and number of data values.Bouncing Ball Experiment How high does the class think a typical ball bounces (compared to its drop height) on its first bounce? Students will conduct an experiment to find out.Adding New Data to a Data Set Given a data set, students will explore how the mean changes as they add data values.Bowling Scores Students will create bowling score data sets that meet certain criteria with regard to measures of center.Mean Number of Fillings Ten people sit in a dentist's waiting room. The mean number of fillings they have in their teeth is 4, yet none of them actually have 4 fillings. Students will explain how this situation is possible.Forestland Students will examine and interpret box plots that show the percentage of forestland in 20 European countries.What's My Data?Students will create a data set that fits a given histogram and then adjust the data set to fit additional criteria.What's My Data 2? Students will create a data set that fits a given box plot and then adjust the data set to fit additional criteria.Compare Graphs Students will make a box plot and a histogram that are based on a given line plot and then compare the three graphs to decide which one best represents the data.Random Numbers What would a data set of randomly generated numbers look like when represented on a histogram? Students will find out!No Telephone? The U.S. Census Bureau provides state-by-state data about the number of households that do not have telephones. Students will examine two box plots that show census data from 1960 and 1990 and compare and analyze the data.Who Is Taller?Who is taller—the boys in the class or the girls in the class? Students will find out by separating the class height data gathered earlier into data for boys and data for girls.
This site displays a click-and-zoom map of the US showing forecast temperatures …
This site displays a click-and-zoom map of the US showing forecast temperatures as well as several other meteorological variables, normally updated every hour. Also available are maps showing chance of precipitation, temperature and wind, weather, dew point, weather, precipitation, dew point and cover.
No restrictions on your remixing, redistributing, or making derivative works. Give credit to the author, as required.
Your remixing, redistributing, or making derivatives works comes with some restrictions, including how it is shared.
Your redistributing comes with some restrictions. Do not remix or make derivative works.
Most restrictive license type. Prohibits most uses, sharing, and any changes.
Copyrighted materials, available under Fair Use and the TEACH Act for US-based educators, or other custom arrangements. Go to the resource provider to see their individual restrictions.