This 8th grade Math parent guide explains the content in straightforward terms so they …
This 8th grade Math parent guide explains the content in straightforward terms so they can support their children’s learning at home and will encourage caretaker engagement with lessons.
Our Teacher Guides are meant to support the use of our online …
Our Teacher Guides are meant to support the use of our online course and unit content. Please use these to accompany the use of our content and for ideas to support struggling learners, those needing extension and for additional resources.
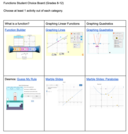
Students will complete a Functions Choice Board they will have two options …
Students will complete a Functions Choice Board they will have two options from each section. What is a function, graphing linear functions and Graphing Quadratic.
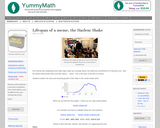
In this lesson, students examine the average rate of change for non-linear …
In this lesson, students examine the average rate of change for non-linear functions and learn that, unlike linear functions, non-linear functions do not have a constant rate of change. Students determine whether an equation is linear or non-linear by examining the rate of change.
In CK-12 Middle School Math Concepts Grade 8, the learning content is …
In CK-12 Middle School Math Concepts Grade 8, the learning content is divided into concepts. Each concept is complete and whole providing focused learning on an indicated objective. Theme-based concepts provide students with experiences that integrate the content of each concept. Students are given opportunities to practice the skills of each concept through real-world situations, examples, guided practice and explore more practice. There are also video links provided to give students an audio/visual way of connecting with the content.
In this lesson, students know that the definition of a graph of …
In this lesson, students know that the definition of a graph of a function is the set of ordered pairs consisting of an input and the corresponding output. Students understand why the graph of a function is identical to the graph of a certain equation.
Sample Learning Goals Explain how the slope of a graphed line can …
Sample Learning Goals Explain how the slope of a graphed line can be computed. Graph a line given an equation in either slope-intercept or point-slope form. Write an equation in slope-intercept or point-slope form given a graphed line. Predict how changing variables in a linear equation will affect the graphed line.
Sample Learning Goals Describe how changing the coefficients of a quadratic function …
Sample Learning Goals Describe how changing the coefficients of a quadratic function changes the graph of the function. Predict how the graph of a parabola will change if the coefficients or constant are varied. Identify the vertex, axis of symmetry, roots, and directrix for the graph of a quadratic equation. Use the vertex form of a quadratic function to describe the graph of the function. Describe the relationship between the focus and directrix and resulting parabola. Predict the graph of a parabola given a focus and directrix.
Sample Learning Goals Graph a line given an equation in slope-intercept form. …
Sample Learning Goals Graph a line given an equation in slope-intercept form. Write an equation in slope-intercept form given a graphed line. Predict how changing the values in a linear equation will affect the graphed line. Predict how changing the graphed line will affect the equation.
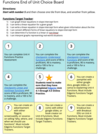
This activity will be used to review all the forms of linear …
This activity will be used to review all the forms of linear equations and to review graphing linear, their parallels and their perpendiculars. All the forms of linear equations will be reviewed for testing purposes. Students will participate in a round robin activity to help students master objectives before unit test.
This task lets students explore the differences between linear and non-linear functions. …
This task lets students explore the differences between linear and non-linear functions. By contrasting the two, it reinforces properties of linear functions. The task lends itself to an extended discussion comparing the differences that students have found and relating them back to the equation and the graph of the two functions.
In this math video lesson on graphs and equations, students will get …
In this math video lesson on graphs and equations, students will get a deeper understanding of the connections between representations of functions, graphs, t-charts, and equations; they will make valid arguments that tie together these forms and show their application in solving problems. This resource supports English language development for English language learners.
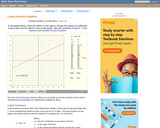
An interactive applet that allows the user to graphically explore the properties …
An interactive applet that allows the user to graphically explore the properties of a linear functions. Specifically, it is designed to foster an intuitive understanding of the effects of changing the two coefficients in the function y=ax+b. The applet shows a large graph of a quadratic (ax + b) and has two slider controls, one each for the coefficients a and b. As the sliders are moved, the graph is redrawn in real time illustrating the effects of these variations. Applet can be enlarged to full screen size for use with a classroom projector. This resource is a component of the Math Open Reference Interactive Geometry textbook project at http://www.mathopenref.com.
The following materials include a Common Core-aligned task and formative assessments which …
The following materials include a Common Core-aligned task and formative assessments which may be integrated into a currently existing curriculum. The final task assesses student mastery of the standards related to linear functions.
In this lesson, students examine and recognize real-world functions, such as the …
In this lesson, students examine and recognize real-world functions, such as the cost of a book, as discrete rates. Students examine and recognize real-world functions, such as the temperature of a pot of cooling soup, as continuous rates.
This course was created by the Rethink Education Content Development Team in …
This course was created by the Rethink Education Content Development Team in partnership with the North Carolina Virtual Public Schools. This course is aligned to the NC Standards for 8th Grade Math.
No restrictions on your remixing, redistributing, or making derivative works. Give credit to the author, as required.
Your remixing, redistributing, or making derivatives works comes with some restrictions, including how it is shared.
Your redistributing comes with some restrictions. Do not remix or make derivative works.
Most restrictive license type. Prohibits most uses, sharing, and any changes.
Copyrighted materials, available under Fair Use and the TEACH Act for US-based educators, or other custom arrangements. Go to the resource provider to see their individual restrictions.