This unit of instruction is focused on the introduction of a precise …
This unit of instruction is focused on the introduction of a precise definition of functions as students transition to the more formalized study of algebra. This task asks students to analyze graphs of functions and interpret rates of change, intersections, and points on the curves of different functions.
This 8th grade Math parent guide explains the content in straightforward terms so they …
This 8th grade Math parent guide explains the content in straightforward terms so they can support their children’s learning at home and will encourage caretaker engagement with lessons.
Our Teacher Guides are meant to support the use of our online …
Our Teacher Guides are meant to support the use of our online course and unit content. Please use these to accompany the use of our content and for ideas to support struggling learners, those needing extension and for additional resources.
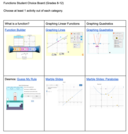
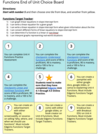
Students will complete a Functions Choice Board they will have two options …
Students will complete a Functions Choice Board they will have two options from each section. What is a function, graphing linear functions and Graphing Quadratic.
In this lesson, students qualitatively describe the functional relationship between two types …
In this lesson, students qualitatively describe the functional relationship between two types of quantities by analyzing a graph. Students sketch a graph that exhibits the qualitative features of linear and nonlinear functions based on a verbal description.
In this lesson, students describe qualitatively the functional relationship between two types …
In this lesson, students describe qualitatively the functional relationship between two types of quantities by analyzing a graph. Students sketch a graph that exhibits the qualitative features of a function based on a verbal description.
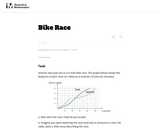
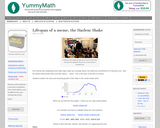
The purpose of this task is for students to interpret two distance-time …
The purpose of this task is for students to interpret two distance-time graphs in terms of the context of a bicycle race. There are two major mathematical aspects to this: interpreting what a particular point on the graph means in terms of the context, and understanding that the "steepness" of the graph tells us something about how fast the bicyclists are moving.
In CK-12 Middle School Math Concepts Grade 8, the learning content is …
In CK-12 Middle School Math Concepts Grade 8, the learning content is divided into concepts. Each concept is complete and whole providing focused learning on an indicated objective. Theme-based concepts provide students with experiences that integrate the content of each concept. Students are given opportunities to practice the skills of each concept through real-world situations, examples, guided practice and explore more practice. There are also video links provided to give students an audio/visual way of connecting with the content.
Students utilize data tables culled from the US DOE Energy Information Agency …
Students utilize data tables culled from the US DOE Energy Information Agency to create graphs that illustrate what types of energy we use and how we use it. An MS Excel workbook with several spreadsheets of data is provided. Students pick (or the teacher assigns) one of the data tables from which students create plots and interpret the information provided. Student groups share with the class their interpretations and new perspectives on energy resources and use.
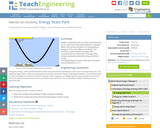
Students experiment with an online virtual laboratory set at a skate park. …
Students experiment with an online virtual laboratory set at a skate park. They make predictions of graphs before they use the simulation to create graphs of energy vs. time under different conditions. This simulation experimentation strengths their comprehension of conservation of energy solely between gravitational potential energy and kinetic energy
In this lesson, students prove that any point on the graph of …
In this lesson, students prove that any point on the graph of y = mx + b is on a line l and that any point on a line l is a point on the graph of y = mx + b. Students graph linear equations on the coordinate plane.
In this lesson, students graph a line specified by a linear function. …
In this lesson, students graph a line specified by a linear function. Students graph a line specified by an initial value and rate of change of a function and construct the linear function by interpreting the graph. Students graph a line specified by two points of a linear relationship and provide the linear function.
During this lesson students will measure the effects of the height of …
During this lesson students will measure the effects of the height of an inclined plane on the force a marble produces to move a plastic, foam, or paper cup across a table. Students will discover that the higher the incline plane, the more force produced by the marble, which moves the cup a greater distance. Students will also learn how to graph data and discover the appropriate graph to use for comparison.
This lesson unit is intended to help teachers assess how well students …
This lesson unit is intended to help teachers assess how well students are able to interpret distanceĐtime graphs and, in particular, to help you identify students who: interpret distanceĐtime graphs as if they are pictures of situations rather than abstract representations of them; and have difficulty relating speeds to slopes of these graphs.
This is a unit that formalizes the definition of functions. Students will …
This is a unit that formalizes the definition of functions. Students will connect the idea of mathematical relationships to the concept of functions. With a mix of direct instruction, guided notes with procedural practice, and individual practice, this unit will ground students in the concept and provide a deep understanding of its usefulness.
In this lesson, eighth grade students will collect data. They will use …
In this lesson, eighth grade students will collect data. They will use this data to analyze the relationship between the height of an individual and the length of his/her foot. Students will use a line of fit to make predictions for people of different heights.
In this math video lesson on graphs and equations, students will get …
In this math video lesson on graphs and equations, students will get a deeper understanding of the connections between representations of functions, graphs, t-charts, and equations; they will make valid arguments that tie together these forms and show their application in solving problems. This resource supports English language development for English language learners.
In this two-part example from Illuminations, users can drag a slider on …
In this two-part example from Illuminations, users can drag a slider on an interactive graph to modify a rate of change (cost per minute for phone use) and learn how modifications in that rate affect the linear graph displaying accumulation (the total cost of calls). In this first part, Constant Cost per Minute, the cost per minute for phone use remains constant over time. In the second part, Changing Cost per Minute, the cost per minute for phone use changes after the first sixty minutes of calls. e-Math Investigations are selected e-examples from the electronic version of the Principles and Standards of School Mathematics (PSSM). The e-examples are part of the electronic version of the PSSM document. Given their interactive nature and focused discussion tied to the PSSM document, the e-examples are natural companions to the i-Math investigations.
No restrictions on your remixing, redistributing, or making derivative works. Give credit to the author, as required.
Your remixing, redistributing, or making derivatives works comes with some restrictions, including how it is shared.
Your redistributing comes with some restrictions. Do not remix or make derivative works.
Most restrictive license type. Prohibits most uses, sharing, and any changes.
Copyrighted materials, available under Fair Use and the TEACH Act for US-based educators, or other custom arrangements. Go to the resource provider to see their individual restrictions.