This lesson will provide real world examples that involve setting up and solving for an exponential growth problem.
- Subject:
- Mathematics
- Material Type:
- Demonstration
- Provider:
- Sophia
- Date Added:
- 04/17/2018

This lesson will provide real world examples that involve setting up and solving for an exponential growth problem.
This is a very open-ended task designed for students to develop some of the basic ideas surrounding exponential growth. While implementations will vary, the core idea is that each fold of the piece of paper doubles the height of the stack. Combined with an estimate of the original thickness of the paper and the distance to the moon, this is enough information to deduce the minimum number of folds to get there.
Given a set of points on a graph, students will find one linear function and one quadratic function which, between them, pass through all the points.

Students will use a video about two rival competitive eaters to explore linear and quadratic patterns.

This resource includes an introduction to inequalitites. It includes a note guide, a practice and assessment options. Photo by Roman Mager on Unsplash
This lesson module allows students to explore the meaning of inequalities. After this lesson, students should be able to understand that there are multiple solutions to an inequality. It contains a formative assessment matching activity at the end and a critical thinking closing activity.

Students will extend their study of functions to include function notation and the concepts of domain and range by exploring examples of functions and their graphs, focusing on the contrast between linear and exponential functions. They interpret functions given graphically, numerically, symbolically, and verbally; translate between representations; and understand the limitations of various representations.

Students are given 4-5 coordinate points, that will represent the sheep. First, they are tasked with creating a fence around the sheep. The students will use the endpoints of each piece of fence to compute the slope, y-intercept, domain and equation of the line. They will then code the rover to draw their lines. Finally, the students can calculate the area/perimeter of their fence and calculate the cost to build the fence. The students will then be challenged to minimize the area, perimeter and cost of building their corral, recalculate the equations of their lines, stating their new slope, y-intercept, and domain.

Students are given 5 random coordinate points and must create a path of linear equations to navigate the rover around each point. Teachers can have students calculate the slope, y-intercept, domain and range of the lines. Students will calculate the distance of each line and find the total distance the rover travelled. Students will then be challenged to minimize the distance the rover travelled. Teachers can extend this to include angles and distance, where the students calculate the angle the rover should turn and then the distance it should drive to go around each point.

Adapted from mathematicsvisionproject.com’s Material Overview:
The Mathematics Vision Project (MVP) was created as a resource for teachers to implement the Common Core State Standards (CCSS) using a task-based approach that leads to skill and efficiency in mathematics by first developing understanding. The MVP approach develops the Standards of Mathematical Practice through experiential learning. Students engage in mathematical problem solving, guided by skilled teachers, in order to achieve mathematical proficiency: conceptual understanding, procedural fluency, strategic competence, adaptive reasoning, and productive disposition. The MVP authors created a curriculum where students do not learn solely by either “internalizing what a teacher or book says or, on the other hand, solely by inventing mathematics on their own.”
The MVP classroom experience begins by confronting students with an engaging problem and allows them to grapple with solving it. As students’ ideas emerge, take form, and are shared, the teacher deliberately orchestrates the student discussions and explorations toward a focused math goal. Students justify their own thinking while clarifying, describing, comparing, and questioning the thinking of others leading to refined thinking and mathematical fluency. What begin as ideas become concepts that lead to formal, traditional math definitions and properties. Strategies become algorithms that lead to procedures supporting efficiency and consistency. Representations become tools of communication which are formalized as mathematical models. Students learn by doing mathematics.
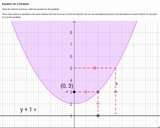
Image of parabola on coordinate plane, with hot spots indicating focus and directrix, along with an example of deriving the equation for a parabola given the focus and directrix.

This video models a context that concerns a candy vending machine. The model turns out to be a quadratic inequality.
Learn how to develop an equation from a real world scenario and solve the equation in one step. As a necessary skill set in Algebra 1, modeling situations with numbers and operations and using inverse operations to find solutions is covered in this tutorial.
This resource provides word problems that will have students come up with equations with one variable to represent linear relationships to real world problems.
This lesson unit is intended to help teachers assess how well students are able to solve quadratics in one variable. In particular, the lesson will help teachers identify and help students who have the following difficulties: making sense of a real life situation and deciding on the math to apply to the problem; solving quadratic equations by taking square roots, completing the square, using the quadratic formula, and factoring; and interpreting results in the context of a real life situation.
Analyze and solve verbal problems whose solution requires solving a linear equations in one variable or linear inequality in one variable.

Spiral Review on expressions, equations, consecutive integers, etc.We use Spirals to review past content. They are ususally given out once a week.

Students will synthesize what they have learned about functions to select the correct function type in a series of modeling problems. Students must also draw on their study of statistics, using graphs and functions to model a context presented with data and/or tables of values. In this module, the modeling cycle is used as the organizing structure, rather than function type.

Exit Ticket
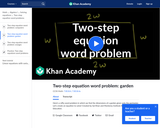
Here's a nifty word problem in which we find the dimensions of a garden given only the perimeter.