This a project to get students to build cases with their teams to determine if schools should start later.
- Subject:
- Social Studies
- Material Type:
- Case Study
- Data Set
- Lecture Notes
- Date Added:
- 10/12/2016

This a project to get students to build cases with their teams to determine if schools should start later.

This paper model shows the orbit of Comet ISON (late 2013) with respect to the innermost planets of the solar system. After reading background information about comets - how they form and where they come from - students cut out and tape together the pieces of the model provided to show its orbital pathway (a single page of parts that can be assembled using just scissors and adhesive). Links are provided to related classroom activities and additional resources.
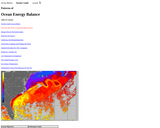
Oceans play a significant role in determining and moderating the effects of energy imbalances. Students will begin this lesson by working with temperature data to reinforce the importance of protocols, practice computing statistical measures of data and interpreting their significance. The lesson continues with investigations into daily and annual energy cycles. Using a sea surface environment visualizer, students then identify patterns of sea surface current and temperature data. Note that this is lesson five of five on the Ocean Motion website. Each lesson investigates ocean surface circulation using satellite and model data and can be done independently. See Related URL's for links to the Ocean Motion Website that provide science background information, data resources, teacher material, student guides and a lesson matrix.
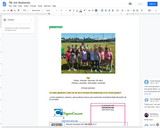
A 2nd grade STEM unit on biodiversity. Students will learn about habitats and their biotic and abiotic components and needs to create and implement a plan/device to increase the biodiversity of the urban school garden.
The H-R diagram is a scatter graph of stars, a plot of stellar absolute magnitude or luminosity versus temperature or stellar classification. It is an important astronomical tool for understanding how stars evolve over time. Stellar evolution cannot be studied by observing individual stars as most changes occur over millions and billions of years. Astrophysicists observe numerous stars at various stages in their evolutionary history to determine their changing properties and probable evolutionary tracks across the H-R diagram. In this activity, students plot both maxima and minima with corresponding stellar classifications for several variables, and then identify the type of variability: Cepheid, RR Lyrae, Mira or Semiregular. This activity includes background information, a teacher guide, a student activity, and accompanying worksheets. The American Association of Variable Star Observers (AAVSO) and The Chandra X-Ray mission have collaborated to develop this activity.

This is an activity about the altitude and azimuth for the Moon. Learners will use the Sky Tonight online program to take data on the position of the Moon, plot it and see what kind of relationship the data has. This activity requires the use of a computer with Internet access, and is Sky Tonight Activity 5 in a larger resource, Space Update.

In this learning activity, students compare changes in insolation with changes in surface temperature in the polar regions using scientific visualizations of global data sets. Links to readings related to the shrinking ice cap and albedo are included. This is part 1 of a four-part activity on polar science. Extension activities examining air and sea surface temperature in relation to changing Earth albedo are included. This activity is one of several learning activities connected with the 2007 GLOBE Earth system poster.

Graph reading and data analysis are highlighted in this activity where students identify the countries that produce the highest levels of polluting atmospheric emissions. They compare these data with the population of the countries, and describe how the percentage of total emissions and total population numbers are related. The resource includes the graph and a student worksheet. This is an activity from Space Update, a collection of resources and activities provided to teach about Earth and space. Summary background information, data and images supporting the activity are available on the Earth Update data site.
This PBL is designed for second grade students. To help understand our school and how to keep the students and staff healthy, the students will investigate different ways to prevent influenza germs from spreading. After considering each germ, they will have the opportunity to create evidence by researching and talking to different resources to come up with the best prevention method for our school.
This module focuses on ultraviolet radiation on Earth and in space and how it affects life. Learners will construct their own "martian" using craft materials and UV beads. They will explore how UV radiation from the Sun can affect living things, comparing conditions on Earth and Mars, and then discuss ways in which organisms may protect themselves from UV radiation. They will then take part in a Mars Creature Challenge, where they will change their creature to help it survive harsh UV conditions — like on Mars. They will then test their Mars creatures by subjecting them to different environmental conditions to see how well they "survive" in a martian environment. This investigation will explore shelter and protection as one of life’s requirements and how Earth’s atmosphere protects life from harmful UV radiation. It also includes specific tips for effectively engaging girls in STEM. This is activity 5 in Explore: Life on Mars? that was developed specifically for use in libraries.
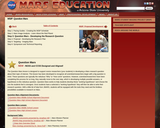
This is a lesson about generating hypotheses and testable questions. Learners will use critical thinking and a collaborative approach to pose questions related to the study of Mars and evaluate the quality of their questions. They will explore remote-sensing data collected by a camera orbiting Mars - the Thermal Emission Imaging System (THEMIS) and develop a team science question. Students will practice critical thinking skills, use a collaborative approach to this first critical step of the scientific process. Exploring the images of the surface of Mars in Visible (VIS) images, students will come up with a topic of study, their team science question and hypotheses. The lesson models scientific inquiry using the 5E instructional model and includes teacher notes and vocabulary.

Teachers can use this survey since the first day of the school to meet their students intoroducing everybosy in class having a guideline that ask them the questions to answer then to help the to write a parragrapf about themselves.They can lear how to make questions and alse what kind of questions they can make and what kind of questions they cannot make in the USA, in this case you ahve a chance to teach or provide some cultural information

This is an activity about image resolution. Learners will recreate a solar image taken by the Solar Dynamics Observatory (SDO) using various sizes of building bricks, and discuss how their recreations relate to image resolution. Learners will also compare SDO images to solar images from older spacecraft to see how improved technology helps scientists learn more about the Sun.

In this paper and pencil exercise, students create graphs that describe the effect of a series of experiments using Daisy World, an energy balance model, that can be used to demonstrate concepts of equilibrium, homeostatis, and positive and negative feedbacks. Internet access and exploration with the actual Daisy World model is ideal, but not required. The resource is Activity 6 of the learning module, Global Balance, part of the lesson series Potential Impacts of Climate Variability and Change.

This is an activity about size and scale. Learners will create and walk through a distance scale model of the size of the Solar System. This activity requires a straight line distance of approximately 295 meters (300 yards).

In this hands-on activity, students learn about the different realms of the Universe and explore their sizes and relative scales. They will be guided through a process that uncovers the immense sizes of the Sun, Solar System, Solar Neighborhood, Milky Way, Local Group, Supercluster, and the observable Universe. The full version of this activity involves students doing simple math computations, however it can also be done without the math. There are some inexpensive materials involved, as well as a powerpoint presentation. It is intended for grades 8-12, but can be adapted down for lower grade levels.

In this hands-on activity, learners begin by estimating the size of each planet in our Solar System and Pluto and making each out of playdough or a similar material. Then, learners follow specific instructions to divide a mass of playdough into the size of each planet and Pluto and compare the actual modeled sizes to the students' own predictions. This activity requires a large amount of playdough material per group of learners. Three pounds is the minimum amount required for each group.
Welcome to Smithsonian Open Access, where you can explore and reuse millions of digital items from the Smithsonian’s collections (2.8 million at February 2020 launch). We have released these images and data into the public domain as Creative Commons Zero (CC0), meaning you can use, transform, and share our open access assets without asking permission from the Smithsonian.
This is a lesson about density. Learners will relate the concept of density to the density of dust in space. They will use mission data from the Student Dust Counter (SDC) interface to determine the density of dust grains in a volume of space in the Solar System in order to answer questions concerning the distribution of dust in the solar system. They will discover that space is much more sparsely populated with dust than they may have thought. Students discuss their findings with the class.
This series of ten lessons has been developed to teach students about local and global water issues. They are based on NASA’s Global Precipitation Measurement (GPM) Mission. The activities are done largely outdoors and include scientific data collection and analysis and integrate technology. Many of the lessons involve data collected based on protocols from the GLOBE Program. Each lesson is designed to take one hour; the lessons build on each other, but can also be used independently. Each lesson topic includes a lesson plan, PowerPoint presentation, student capture sheet and capture sheet answer guide.