This parent guide supports parents in helping their child at home with …
This parent guide supports parents in helping their child at home with the 1st Grade Math content. Within the folder you will access Parent Guide PDFs in FIVE Languages: Arabic, English, Hindi, Spanish, and Vietnamese to help on-going communication with caregivers.
This resource accompanies our Rethink 1st Grade Math Measurement & Data unit. It …
This resource accompanies our Rethink 1st Grade Math Measurement & Data unit. It includes ideas for use, ways to support exceptional children, ways to extend learning, digital resources and tools, tips for supporting English Language Learners and students with visual and hearing impairments. There are also ideas for offline learning.
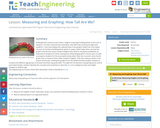
Students will work in groups to create a Keva Plank bridge that …
Students will work in groups to create a Keva Plank bridge that spans an 8.5 inch “river” (sheet of paper). The bridge needs to span the river (touch in the middle) and can have no blocks touching any water. Students will record data on how many blocks they plan to use + how many they actually use in their attempts, as well as the most and least used in the class. Students will also reflect on group designs as well as how to improve their own work.
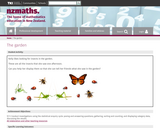
There are many simple experiments students can do to analyze data. They …
There are many simple experiments students can do to analyze data. They can test two objects designed to solve the same problem and compare the strengths and weaknesses of how each performs. The teacher will create a spreadsheet to collect the data to share with the students.
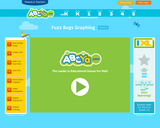
This engaging interactive gives students the opportunity to create a bar graph …
This engaging interactive gives students the opportunity to create a bar graph by sorting the Fuzz Bugs. Next, they interpret the graph by answering five different questions. Audio support is provided as well as feedback after each guess.
Students will explain the need to reduce the amount of trash they …
Students will explain the need to reduce the amount of trash they generate, and describe ways in which they can make changes in their actions to support waste reduction. Students will collect, analyze, and graph data related to the weight of collected trash for several consecutive days. Students will also write letters to communicate their ideas and inform readers about their actions to reduce waste.
In this interactive game, students are challenged to count, compare, and express …
In this interactive game, students are challenged to count, compare, and express how many more or less when presented with numerical data in picture format.
Kindergartners measure each other's height using large building blocks, then visit a …
Kindergartners measure each other's height using large building blocks, then visit a 2nd and a 4th grade class to measure those students. They can also measure adults in the school community. Results are displayed in age-appropriate bar graphs (paper cut-outs of miniature building blocks glued on paper to form a bar graph) comparing the different age groups. The activities that comprise this lesson help students develop the concepts and vocabulary to describe, in a non-ambiguous way, how height changes as children get older. The introduction to graphing provides an important foundation for both creating and interpreting graphs in future years.
This book, presented in video format with accompanying lesson plans and activities, …
This book, presented in video format with accompanying lesson plans and activities, provides ELLs the opportunity to read, write, listen, speak and learn new vocabulary about a variety of language arts, mathematics and science skills including character, setting, plot sequence, patterns and research. (NOTE: You must search far down the page to find the Bear Hunt resources.)
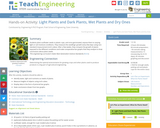
Students plant sunflower seeds in plastic cups, and once germinated, expose them …
Students plant sunflower seeds in plastic cups, and once germinated, expose them to varying light or soil moisture conditions. They measure growth of the seedlings every few days using non-standard measurement (inch cubes). After a few weeks, they compare the growth of plants exposed to the different conditions and make bar comparative graphs, which they analyze to draw conclusions about the needs of plants.
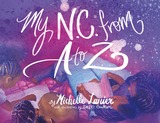
This lesson accompanies the North Carolina children's book, "My NC from A …
This lesson accompanies the North Carolina children's book, "My NC from A to Z" which celebrates pride of place, and creates connections to North Carolina's rich African American heritage. In this lesson, students will compare and contrast two to five North Carolina African American visual artists by making art and Venn diagrams.
No restrictions on your remixing, redistributing, or making derivative works. Give credit to the author, as required.
Your remixing, redistributing, or making derivatives works comes with some restrictions, including how it is shared.
Your redistributing comes with some restrictions. Do not remix or make derivative works.
Most restrictive license type. Prohibits most uses, sharing, and any changes.
Copyrighted materials, available under Fair Use and the TEACH Act for US-based educators, or other custom arrangements. Go to the resource provider to see their individual restrictions.